Converting Excel Spreadsheets to PDF: Preserve Layout, Readability, and Structure
Excel-to-PDF conversion is usually quick, but the results can be frustrating: columns get cut off, headers disappear, page breaks land in the wrong place, or charts turn blurry. These issues happen because Excel is an interactive grid designed for screen layouts, while PDF is a fixed layout format designed for printing and sharing.
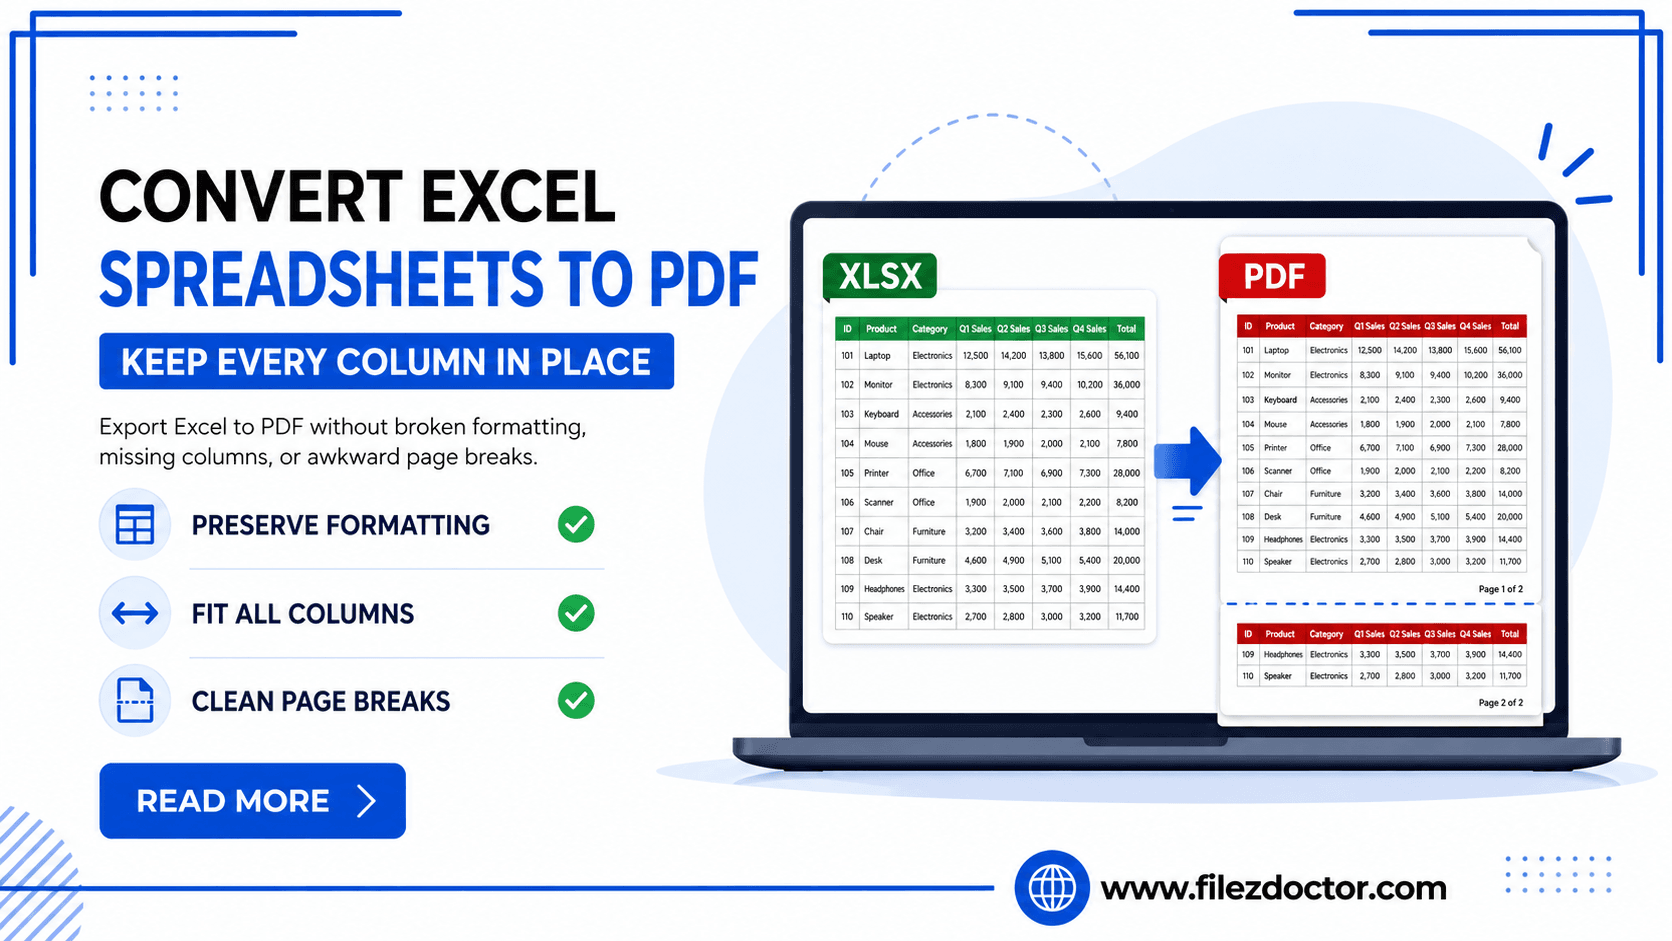
For a consistent export workflow, use Excel to PDF from FilezDoctor to convert spreadsheets while keeping formatting predictable.
What to prepare in Excel before exporting
Spend a few minutes in Excel first. The export will be much more reliable.
1. Set or confirm the print area
If you export without defining what to include, Excel might choose an unexpected region. Set the print area to the table or report section you want.
2. Ensure column widths and row heights are reasonable
If columns are too narrow or cells are wrapped unexpectedly, they can overflow when rendered into PDF.
3. Use stable headers and titles
Make sure your header rows are clearly formatted. If your report uses repeated header rows across pages, enable the appropriate repeat setting (if available).
4. Check charts and images
Charts should be sized so they remain readable at the target page width. If your sheet includes images, verify they don’t overlap table content.
Step-by-step conversion approach
Step 1: Choose the “PDF intent”
Decide what the PDF must accomplish:
- easy on-screen reading,
- printing on specific paper sizes,
- sharing data with clients,
- archiving.
This affects page orientation, scaling, and whether you need to split the content.
Step 2: Normalize the spreadsheet layout
Before conversion:
- remove extra blank rows/columns outside the report area,
- confirm that the sheet uses consistent fonts and sizes,
- ensure filters and hidden columns are handled the way you expect.
If some columns are hidden for analysis, decide whether those columns should appear in the PDF.
Step 3: Convert using FilezDoctor
Use Excel to PDF:
- Upload the spreadsheet.
- Select conversion preferences if available (for example, paper size, orientation, or scaling).
- Convert and download the PDF.
Step 4: Verify pagination and readability
Open the PDF and check:
- every column is visible (no truncated text),
- headers appear where they should,
- charts render clearly,
- page breaks don’t split critical sections (like a totals row).
If something is off, return to Excel, adjust print area or scaling, then reconvert.
Tips to avoid the most common formatting failures
Problem 1: Missing or cut-off columns
Fix by adjusting column widths, selecting a narrower print area, or using scaling options that keep content within page margins.
Problem 2: Awkward page breaks
Use page break preview in Excel (if you’re comfortable with it) and move breaks so they align with logical sections.
Problem 3: Tiny text
Scaling down too much can make the PDF hard to read. Consider splitting a large report into two PDFs (for example, “Summary” and “Details”).
Problem 4: Charts look blurry
Ensure charts are not too small on the page. If possible, set chart dimensions so they occupy a meaningful portion of the PDF page.
Common pitfalls to consider
Pitfall 1: Converting hidden filters unexpectedly
Sometimes filtered views or hidden columns behave differently during export. Confirm whether the PDF should show the full dataset or only the filtered results.
Pitfall 2: Using volatile formatting
Conditional formatting that depends on volatile calculations can shift between conversions. If the PDF is meant to reflect a specific state, ensure calculations are up to date before exporting.
Pitfall 3: Forgetting to test the “real” sheet
If you template the spreadsheet, export a real example with typical data—not just a blank or sample sheet—to validate layout.
Troubleshooting after conversion
Even with good preparation, you may see output surprises. Here are targeted fixes you can try without restarting from scratch:
- Re-check scaling: if the PDF looks “shrunk” and text becomes unreadable, use an option that scales to fit a page more predictably or revert to a larger paper size.
- Adjust chart size and position: charts that overlap cell content in Excel may render differently in PDF. Resize the chart area so it occupies its own space.
- Fix unexpected page breaks: if a totals row splits awkwardly, define a clearer print area or add a manual page break in Excel where the report should logically transition.
- Validate fonts: if you see font substitutions (for example, numbers or symbols changing appearance), try switching to common fonts in Excel before exporting.
- Confirm orientation: landscape vs portrait errors often look like “missing columns” or compressed numbers. Orientation is one of the fastest things to correct.
Once you address the most likely cause, convert again and compare a single representative page before rerunning the whole report.
FAQ
Will converting to PDF preserve formulas?
PDF is a fixed layout format, so formulas generally do not remain editable. The PDF captures the rendered values and visuals.
Can I export only one worksheet?
Yes, most workflows let you select which sheet to export. Choose the report tab you want to share.
Why do fonts look different in the PDF?
Font substitution can happen when the environment differs from Excel. A reliable conversion tool tries to embed or match fonts, but the best approach is using common, standard fonts.
Is PDF better than Excel for sharing?
PDF is better for fixed layout communication, printing, and preventing accidental edits. Excel is better when recipients must analyze and manipulate data.
Ready to optimize your PDFs?
Experience the world's fastest PDF tools today.